Image Details
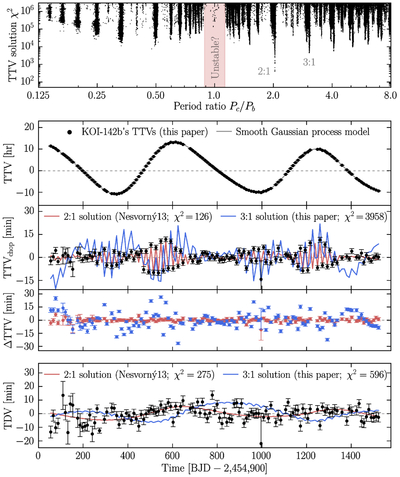
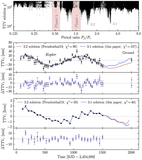
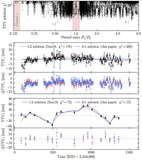
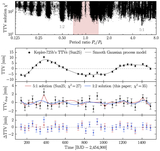
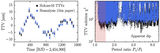
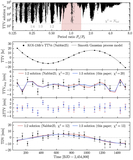
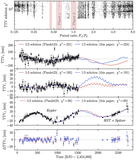
Caption: Figure 1.
KOI-142. Top panel: χ2 vs. period ratio (Ndof = 231). The minimum near the 2:1 MMR is substantially deeper than any competing solution. Second panel: measured TTVs from this work (Section 3.1). The gray curve shows a Gaussian process (GP) regression used solely as a smooth interpolant to separate long- and short-timescale variations. Third panel: high-pass-filtered TTVs obtained by subtracting the GP. The red curve shows the best variant of the 2:1 solution (D. Nesvorný et al. 2013); the blue curve shows the 3:1 solution, which is second-best. The short-timescale “chopping” signal strongly favors the 2:1 model. Fourth panel: residuals of the 2:1 solution (rms = 2.2 minutes) and the 3:1 solution (rms = 9.2 minutes). The 3:1 model fails to reproduce the short-timescale structure. Fifth panel: TDVs and model predictions. The 2:1 model also provides a superior fit to the TDVs. KOI-142’s TTV solution appears unambiguously unique.
Other Images in This Article
Show More
Copyright and Terms & Conditions
© 2026. The Author(s). Published by the American Astronomical Society.