Image Details
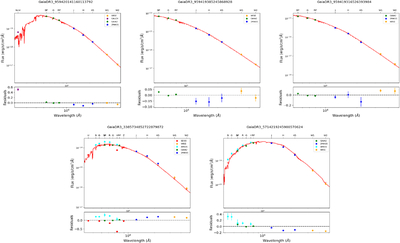
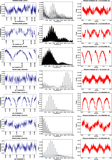
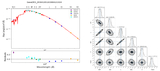
Caption: Figure A2.
Spectral energy distribution fits for the remaining variable stars identified in the observed OCs, shown here for completeness. The observed multiband photometric fluxes are plotted together with the best-fitting Kurucz model atmospheres, while the lower panels display the corresponding residuals. These SEDs were used to estimate the stellar parameters reported in Table 3.
Other Images in This Article
Show More
Copyright and Terms & Conditions
© 2026. The Author(s). Published by the American Astronomical Society.
Copyright ©
2026 Astronomy Image Explorer. All Rights Reserved.