Image Details
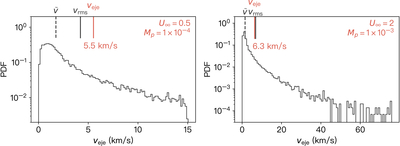
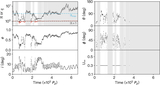
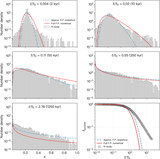
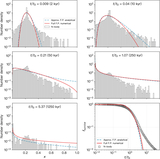
Caption: Figure 12.
Ejection speed distributions from the two scattering simulations shown in Figure 8 (left) and Figure 9 (right). The black histograms represent the simulated distributions. The theoretical rms ejection speeds veje, computed using Equation (68), are shown as red solid lines, while the numerical vrms values are shown as black solid lines. Median ejection speeds ﹩\tilde{v}﹩ are indicated by black dashed lines. In both simulations, the planet is placed on a circular orbit with ap = 1 au, corresponding to an orbital speed of vp ≈ 30 km s−1.
Other Images in This Article
Show More
Copyright and Terms & Conditions
© 2026. The Author(s). Published by the American Astronomical Society.
Copyright ©
2026 Astronomy Image Explorer. All Rights Reserved.