Image Details
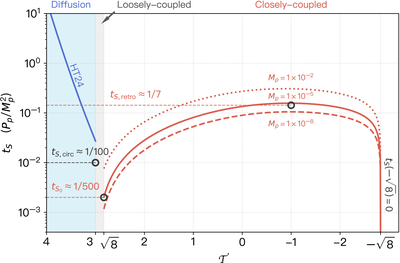
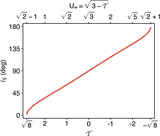
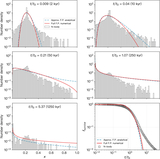
Caption: Figure 7.
Scattering timescale tS (in units of ﹩{P}_{p}/{M}_{p}^{2}﹩) as a function of ﹩{ \mathcal T }﹩ in different regimes. The red curves are computed using the full analytical expression (Equation (58)) in the closely coupled regime, with Mp = 1 × 10⁻² (dotted), 1 × 10⁻⁵ (solid), and 1 × 10⁻⁸ (dashed), respectively. As ﹩{ \mathcal T }\to -\sqrt{8}﹩, tS shoots down to 0. The blue curve represents the best fit of the relaxation timescale in the diffusion regime, given by S. Hadden & S. Tremaine (2024), with a different approach. The narrow gap between the two regimes is the loosely coupled regime, where neither model is valid. The minimum (﹩{t}_{{S}_{0}}﹩), circular (tS,circ), and retrograde (tS,retro) scattering timescales defined in text (Equations (59) and (61)) are marked with black circles.
Other Images in This Article
Show More
Copyright and Terms & Conditions
© 2026. The Author(s). Published by the American Astronomical Society.