Image Details
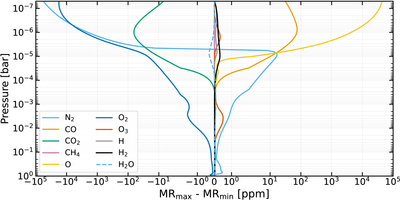
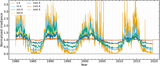
Caption: Figure 14.
Difference in mixing ratio between the maximum and minimum flux scenarios for the species shown in Figure 13. The profile for H2O is dashed because it shares the same color as N2.
Other Images in This Article
Show More
Copyright and Terms & Conditions
© 2026. The Author(s). Published by the American Astronomical Society.
Copyright ©
2026 Astronomy Image Explorer. All Rights Reserved.