Image Details
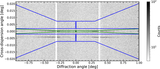
Caption: Figure 1.
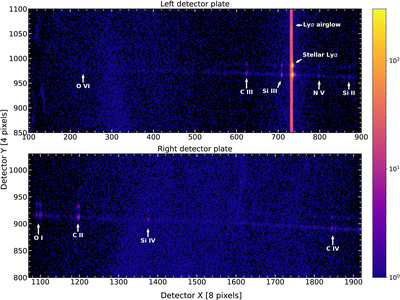
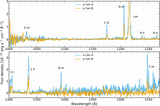
In-flight 2D spectrum of α Cen AB. The top panel shows the shorter-wavelength detector segment (980–1270 Å) and the bottom plot shows the longer-wavelength segment (1300–1580 Å). Data are shown in detector pixel coordinates and binned to 8 pixels in the x-axis (dispersion) and 4 pixels in the y-axis (cross dispersion). For both panels the horizontal lines near the center of the image are the spectral traces of the two stars. The brighter bottom trace is α Cen A and the top trace is α Cen B. The bright vertical line at Lyα is geocoronal airglow, which fills the instrument slit.
Other Images in This Article
Show More
Copyright and Terms & Conditions
© 2026. The Author(s). Published by the American Astronomical Society.
Copyright ©
2026 Astronomy Image Explorer. All Rights Reserved.