Image Details
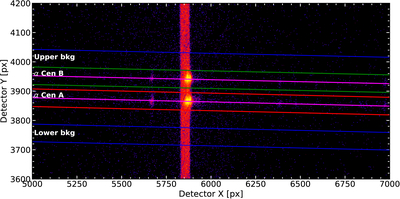
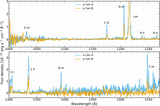
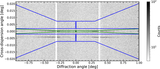
Caption: Figure 4.
Example of the extraction process used to extract the stellar spectra of α Cen A and B from the full 2D flight image. The red lines bound the spectral region of α Cen A, and the green lines the spectral region of α Cen B. The dark blue lines define the background regions. Magenta lines show the linear fit to the spectral trace.
Other Images in This Article
Show More
Copyright and Terms & Conditions
© 2026. The Author(s). Published by the American Astronomical Society.
Copyright ©
2026 Astronomy Image Explorer. All Rights Reserved.