Image Details
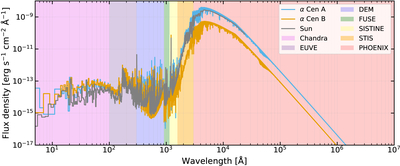
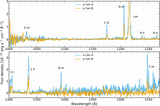
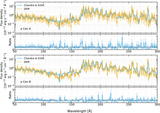
Caption: Figure 6.
Stellar SEDs for α Cen A (blue) and B (orange) binned to 1 Å. The SED of the Sun, scaled to a distance of 1.33 pc, from T. N. Woods et al. (2009) is shown in gray for comparison. Colored background regions show the various regions described in Section 5.2. The regions containing the reconstructed Lyα (1214–1217 Å, Section 5.2.4) and SISTINE detector gap (1270–1300 Å, Section 5.2.3) are not colored for clarity. The PHOENIX model extends to 107 Å but we have restricted the y-axis to 10−17 erg s−1 cm−2 Å−1, again to aid visual clarity of features within the main spectra.
Other Images in This Article
Show More
Copyright and Terms & Conditions
© 2026. The Author(s). Published by the American Astronomical Society.
Copyright ©
2026 Astronomy Image Explorer. All Rights Reserved.