Image Details
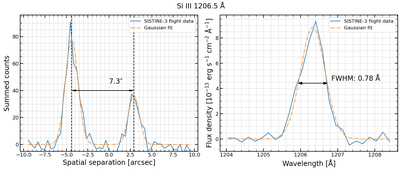
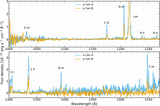
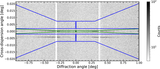
Caption: Figure 2.
Spatial and spectral resolution of SISTINE-3 calculated using the Si III line at 1206.5 Å. Left: Si III lines of α Cen A and B. The larger emission line is from A and the smaller is from B. The lines are separated by ∼7″, which matches the predicted on-sky separation of the stars. Right: Si III emission of α Cen A.
Other Images in This Article
Show More
Copyright and Terms & Conditions
© 2026. The Author(s). Published by the American Astronomical Society.
Copyright ©
2026 Astronomy Image Explorer. All Rights Reserved.