Image Details
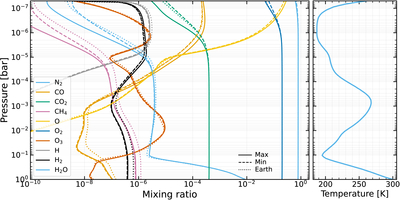
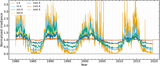
Caption: Figure 13.
Atmospheric mixing ratios and temperature–pressure diagram for the simulated Earth-like terrestrial planet around α Cen A. Solid lines represent the case of maximum flux exposure, dashed lines the case of minimum flux exposure, and dotted lines show the profiles of Earth around the Sun retrieved from S.-M. Tsai et al. (2023).
Other Images in This Article
Show More
Copyright and Terms & Conditions
© 2026. The Author(s). Published by the American Astronomical Society.
Copyright ©
2026 Astronomy Image Explorer. All Rights Reserved.