Image Details
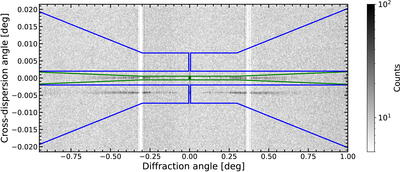
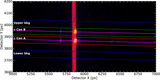
Caption: Figure 9.
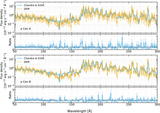
2D LETGS spectra of α Cen A and B. The upper spectral trace is α Cen A and the lower is α Cen B. The green and blue regions show the spectrum extraction region and background extraction regions, respectively. The two empty vertical stripes are gaps between the detector plates, which contain no data. Negative diffraction angle is order m = −1 and positive is m = 1. Note that while the stars are well resolved, the lower background region for α Cen A entirely encloses α Cen B. Likewise, the upper background region for α Cen B (not shown) encloses the spectral trace of A. During extraction of the 1D spectra, we moved the background region of α Cen A (B) down (up) to ensure that none of the spectral trace of the other star remained within the background region.
Other Images in This Article
Show More
Copyright and Terms & Conditions
© 2026. The Author(s). Published by the American Astronomical Society.