Image Details
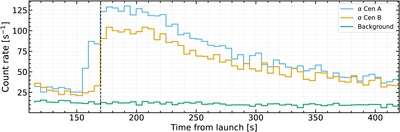
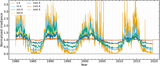
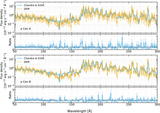
Caption: Figure 3.
In-flight light curves from SISTINE-3. Data have been binned to 5 s intervals. The vertical black line shows when the payload reached its final pointing location. The count rate decreases over the duration of the flight due to the target drifting within the slit during observation.
Other Images in This Article
Show More
Copyright and Terms & Conditions
© 2026. The Author(s). Published by the American Astronomical Society.
Copyright ©
2026 Astronomy Image Explorer. All Rights Reserved.