Image Details
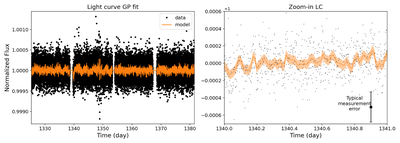
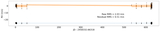
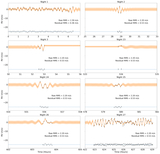
Caption: Figure 6.
GP model in time series of both TESS Sectors 1 and 2 (left) and zoom-in plot of 1 day duration within Sector 1, better illustrating part of the GP model in the time domain (right). The orange line marks the best-fit GP model (with SHO kernels), and the black circles mark the TESS data points (same as Figure 1). See Section 4.3 for more details.
Other Images in This Article
Show More
Copyright and Terms & Conditions
© 2026. The Author(s). Published by the American Astronomical Society.
Copyright ©
2026 Astronomy Image Explorer. All Rights Reserved.