Image Details
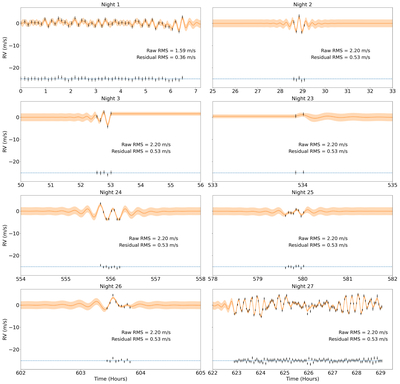
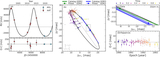
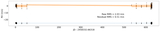
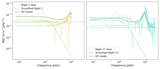
Caption: Figure 9.
Zoom-in RV plots for Figure 8 with the same legend. The rms values are calculated for each observing night and displayed respectively in each subplot. Nights 1–3 and nights 23–27 are each modeled with a GP kernel but fitted with a joint likelihood to share the same set of hyperparameters for the GP, which is done to effectively accommodate the long gap in the baseline.
Other Images in This Article
Show More
Copyright and Terms & Conditions
© 2026. The Author(s). Published by the American Astronomical Society.
Copyright ©
2026 Astronomy Image Explorer. All Rights Reserved.