Image Details
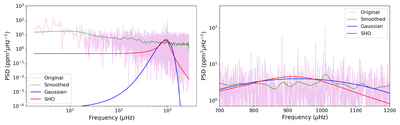
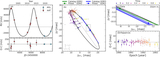
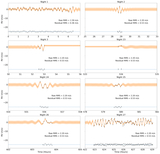
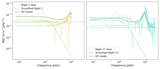
Caption: Figure 5.
PSD of the light curve of HD 5562 from TESS Sectors 1 and 2, covering the whole frequency range (left) and a zoom-in view (right). The green line represents the smoothed spectrum for illustrative purposes, and the blue line is a Gaussian fit to the power spectrum between 700 and 1200 μHz. The pink line represents the original, unsmoothed power spectrum. The red line is an initial guess for the SHO model in our GP regression to fit the light curve, which was derived based on the best-fit Gaussian model (blue) within 700–1200 μHz. See Section 4.2 for more details.
Other Images in This Article
Show More
Copyright and Terms & Conditions
© 2026. The Author(s). Published by the American Astronomical Society.
Copyright ©
2026 Astronomy Image Explorer. All Rights Reserved.