Image Details

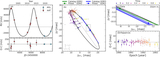
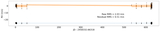
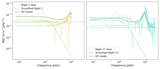
Caption: Figure 3.
Échelle diagram from the asteroseismic analyses (Section 3.3) with the observed (colored symbols) and model (open symbols) frequencies highlighted. The frequency mode (x-axis) shows the different modeled modes with the symbol sizes of ℓ = 1 and 2 modes inversely proportional to their mode inertia scaled to the closest ℓ = 0 modes, which indicates the mode amplitudes.
Other Images in This Article
Show More
Copyright and Terms & Conditions
© 2026. The Author(s). Published by the American Astronomical Society.
Copyright ©
2026 Astronomy Image Explorer. All Rights Reserved.