Image Details
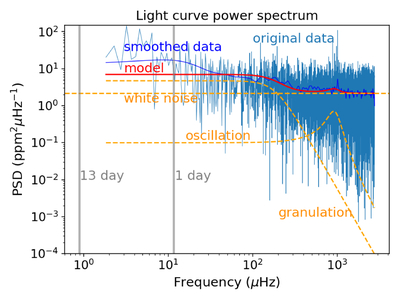
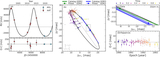
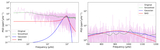
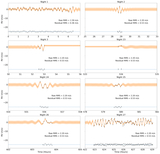
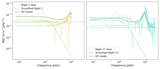
Caption: Figure 7.
The TESS photometry and the best-fit GP model in Fourier space. The blue line represents the PSD of the TESS light curve using the fast chi-squared method of D. M. Palmer (2009); the bright blue line is the smoothed PSD (labeled with “smoothed data”); the red line represents the best-fit GP model, while the dashed orange lines represent each kernel of the GP model with their names labeled. Gray vertical lines indicate two typical aliasing frequencies in TESS data as a result of the satellite’s orbits and the rotation of the Earth.
Other Images in This Article
Show More
Copyright and Terms & Conditions
© 2026. The Author(s). Published by the American Astronomical Society.
Copyright ©
2026 Astronomy Image Explorer. All Rights Reserved.