Image Details
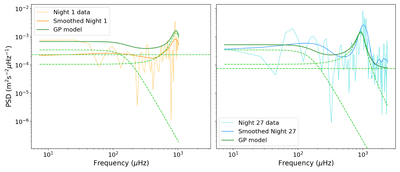
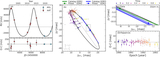
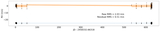
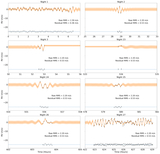
Caption: Figure 10.
PSDs of the RVs taken on each of the two long-observation nights. The light orange and light blue lines represent the original PSDs, while the darker lines are the smoothed. The green solid lines represent the PSDs of the best-fit GP model (same model as in Figures 8 and 9), while the dashed lines are for the model components (granulation, oscillation, and white noise). The PSDs validate the goodness of-fit for the GP models in the frequency domain since the GP regression was only done in the time domain (Figure 9). See Section 4.4 for more details.
Other Images in This Article
Show More
Copyright and Terms & Conditions
© 2026. The Author(s). Published by the American Astronomical Society.
Copyright ©
2026 Astronomy Image Explorer. All Rights Reserved.