Image Details
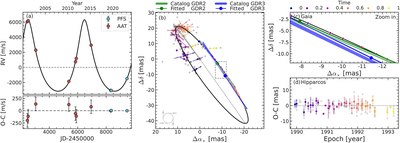
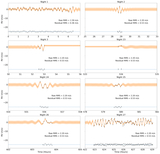
Caption: Figure 4.
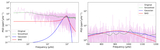
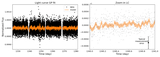
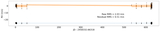
Joint fitting to the RVs, Hipparcos, and Gaia astrometry. (a) RV curve of HD 5562 B. The thick black line shows the best-fit Keplerian orbit. Residuals (O − C) between the observation and the model are plotted underneath. (b) The best-fitting astrometric orbit of HD 5562. The black dashed line inside the orbit connects the ascending node and the descending node. The plus symbol denotes the system’s barycenter, and the gray line connects it with the periapsis. The post-fit Hipparcos abscissa residuals are projected into the R.A. and decl. axes (gray dots) and have been binned into single points with colors. The brightness of these points gradually increases with observation time (the temporal baseline of each satellite is normalized to 1). The orientations of the error bars of each point denote the along-scan direction of Hipparcos. The curl at the lower left corner denotes the orientation of the orbital motion. (c) Zoom-in of the rectangular region of panel (b), which depicts the best fit to Gaia GOST data and the comparison between best fit and catalog astrometry (positions and proper motions) at the GDR2 and GDR3 reference epochs. The blue shaded regions represent the uncertainty of catalog positions and proper motions after removing the motion of the system’s barycenter. The dot and slope of two lines (blue and green) indicate the best-fit position and proper-motion offsets induced by the companion. (d) The residual (O − C) of Hipparcos abscissa.
Other Images in This Article
Show More
Copyright and Terms & Conditions
© 2026. The Author(s). Published by the American Astronomical Society.