Image Details
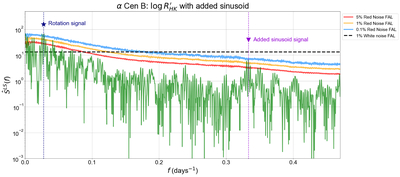
Caption: Figure 8.
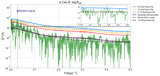
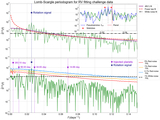
The GLS periodogram of the new time series ﹩{x}_{n}^{{\prime} }﹩ generated by adding a periodic signal to the α Cen B ﹩\mathrm{log}{R}_{\mathrm{HK}}^{{\prime} }﹩ data (X. Dumusque et al. 2012) according to Equation 12. The navy dotted line represents the rotation signal, and the light purple dotted line shows the added sinusoid. The added signal exceeds the 1% FAL/99% significance level from the AR(1) model (blue solid line), but misses the white noise–based 1% FAL (black dashed line).
Other Images in This Article
Show More
Copyright and Terms & Conditions
© 2026. The Author(s). Published by the American Astronomical Society.
Copyright ©
2026 Astronomy Image Explorer. All Rights Reserved.