Image Details
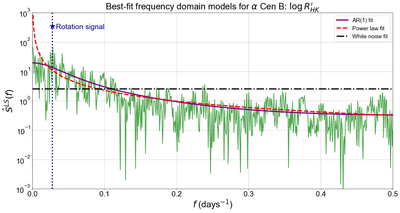
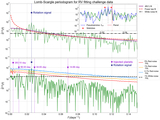
Caption: Figure 1.
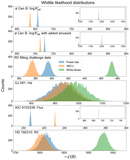
GLS periodogram ﹩{\hat{S}}^{LS}({f}_{k})﹩ (green) of activity indicator ﹩\mathrm{log}R{{\prime} }_{\mathrm{HK}}﹩ of α Cen B (X. Dumusque et al. 2012) with a red noise background. The vertical navy dotted line is the rotation signal, the horizontal black dashed–dotted line is a white noise fit to the spectrum, and the purple solid line and red dotted line are the best-fit versions of two red noise models, AR(1) and a power law (see Section 2 for a detailed description of the red noise models used in this work).
Other Images in This Article
Show More
Copyright and Terms & Conditions
© 2026. The Author(s). Published by the American Astronomical Society.
Copyright ©
2026 Astronomy Image Explorer. All Rights Reserved.