Image Details
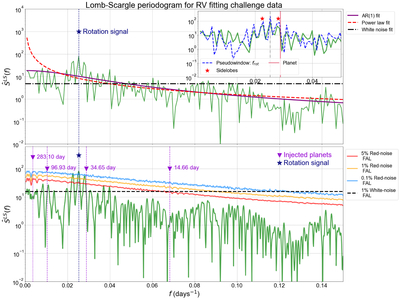
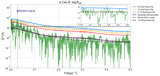
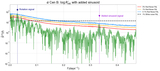
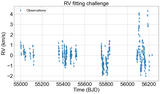
Caption: Figure 10.
RV fitting challenge dataset (X. Dumusque 2016a): Top panel: the GLS periodogram ﹩{\hat{S}}^{\mathrm{LS}}({f}_{k})﹩ (green) with the best-fit AR(1) (purple line), power law (red dashed line). and white noise (blue dashed–dotted line) model fits. The navy dotted lines show the rotation signal. The inset plot shows the pseudowindow at the rotation frequency (dark blue dashed line). From the pseudowindow plot, we see how the injected planet with a period of 34.65 days (pink vertical line) lands right on top of one of the sidelobes (red star) of the rotation signal. Bottom panel: the red noise 5% (red), 1% (orange), and 0.1% (blue) FALs and the 1% white noise FAL (black dashed line) are shown. The vertical dotted light purple lines, along with the marked periods (light purple triangles), represent the injected planets. Only the rotation signal (navy dashed–dotted line) reaches a 0.1% red noise FAL.
Other Images in This Article
Show More
Copyright and Terms & Conditions
© 2026. The Author(s). Published by the American Astronomical Society.