Image Details
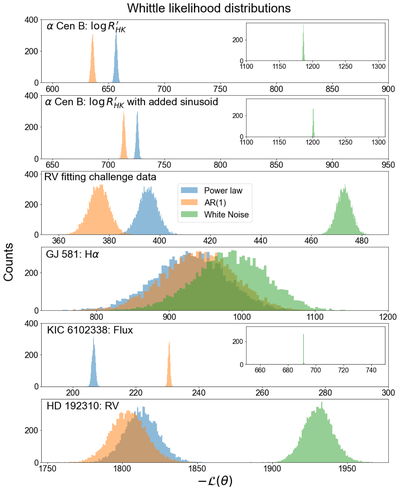
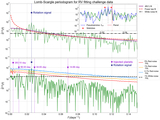
Caption: Figure 5.
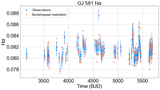
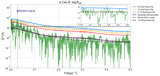
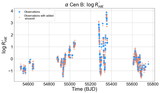
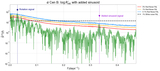
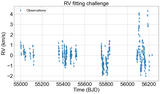
The Whittle NLL distributions created by fitting all three noise models to GLS periodograms of 10,000 realizations of each time series studied in this paper. ﹩-{ \mathcal L }(\theta )﹩ distributions from the AR(1) model are colored orange, ﹩-{ \mathcal L }(\theta )﹩ distributions from the power law model are in blue, and ﹩-{ \mathcal L }(\theta )﹩ distributions from the white noise fits are in green. From top to bottom, the time series are α Cen B ﹩\mathrm{log}R{{\prime} }_{\mathrm{HK}}﹩ (X. Dumusque et al. 2012), simulated RVs from System 11 of the RV fitting challenge (X. Dumusque 2016a), GJ 581 Hα (P. Robertson et al. 2014), Kepler photometry of KIC 6102338 (W. J. Borucki et al. 2010), and HD 192310 RVs (K. Laliotis et al. 2023).
Other Images in This Article
Show More
Copyright and Terms & Conditions
© 2026. The Author(s). Published by the American Astronomical Society.