Image Details
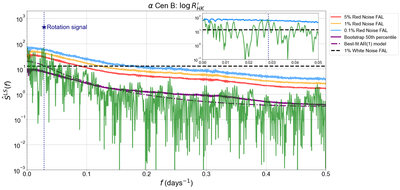
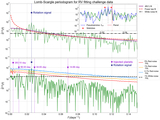
Caption: Figure 6.
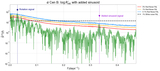
AR(1)-based FALs for the GLS periodogram of the α Cen B ﹩\mathrm{log}{R}_{\mathrm{HK}}^{{\prime} }﹩ time series (X. Dumusque et al. 2012) The 5% (red line), 1% (orange), and 0.1% (blue) red noise FALs follow the shape of the red noise continuum. The 1% white noise FAP estimated by the bootstrap method is plotted for comparison (black dashed line). The best-fit AR(1) model (purple dashed–dotted line) and the 50% percentile (purple line) of the Monte Carlo realizations are also shown. The rotation signal (navy dotted line) reaches the 0.1% FAL or 99.9% significance threshold. The figure inset at the top right shows a zoomed-in version of the plot centered on the rotation signal (navy dotted line), which reaches the 0.1% FAL.
Other Images in This Article
Show More
Copyright and Terms & Conditions
© 2026. The Author(s). Published by the American Astronomical Society.