Image Details
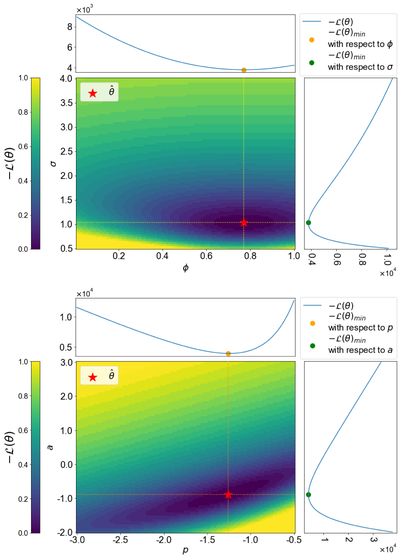
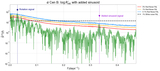
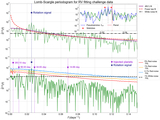
Caption: Figure 3.
Top panel: a 2D color plot of the Whittle NLL function ﹩-{ \mathcal L }(\theta )﹩ against AR(1) model parameters for the GLS periodogram of the X. Dumusque et al. (2012) α Cen B ﹩\mathrm{log}R{{\prime} }_{HK}﹩ time series. The x-axis and y-axis of the colored plot represent ϕ and σw, respectively. Bottom panel: ﹩-{ \mathcal L }(\theta )﹩ for power law models of the same time series. Here the x-axis and y-axis represent normalization a and exponent p, respectively. The color bars are normalized between 0 and 1 for visualization purposes. The blue curves show the marginalization of ﹩-{ \mathcal L }(\theta )﹩ with respect to a single parameter. The minimum values of ﹩-{ \mathcal L }(\hat{\theta })﹩ are marked with red stars.
Other Images in This Article
Show More
Copyright and Terms & Conditions
© 2026. The Author(s). Published by the American Astronomical Society.