Image Details
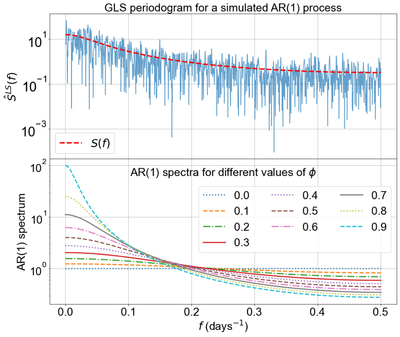
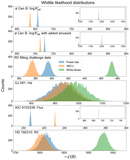
Caption: Figure 2.
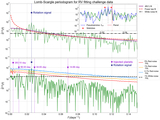
Top panel: GLS periodogram ﹩{\hat{S}}^{LS}({f}_{k})﹩ (blue) of a simulated AR(1) time series (Equation (1) with ϕ = 0.75 and σ = 1). The dashed red line shows the analytic power spectrum S(f) (Equation (5)) of the AR(1), ϕ = 0.75, σ = 1 process. Bottom panel: AR(1) power spectrum for different values of ϕ.
Other Images in This Article
Show More
Copyright and Terms & Conditions
© 2026. The Author(s). Published by the American Astronomical Society.
Copyright ©
2026 Astronomy Image Explorer. All Rights Reserved.