Image Details
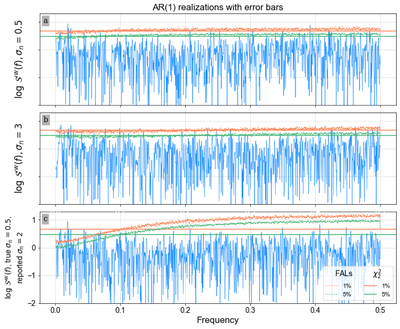
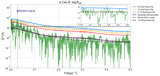
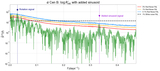
Caption: Figure 16.
Panel (a): whitened log-periodogram ﹩\mathrm{log}{{ \mathcal S }}^{{\prime} w}(f)﹩ and FALs for a time series drawn from the AR(1) process shown in Figure 15 (ϕ = 0.77, σw = 1). Error bars are σn = 0.5. Panel (b): same as panel (a) but with σn = 3. Panel (c): whitened log-periodogram and FALs for a time series for which the error bars are overestimated. The dataset ﹩x{{\prime} }_{n}﹩ has true σn = 0.5, but FALs are calculated using σn = 2.
Other Images in This Article
Show More
Copyright and Terms & Conditions
© 2026. The Author(s). Published by the American Astronomical Society.
Copyright ©
2026 Astronomy Image Explorer. All Rights Reserved.