Image Details
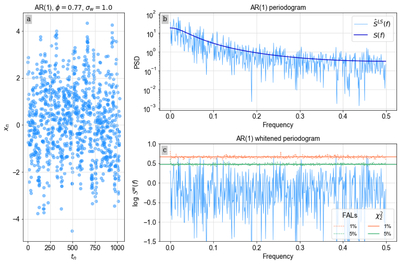
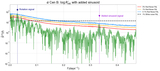
Caption: Figure 15.
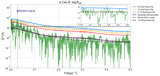
Panel (a): time-domain realization of an AR(1) process with ϕ = 0.77 and σw = 1.0. Panel (b): periodogram ﹩{\hat{S}}^{LS}(f)﹩ (light blue) and true power spectrum S(f) (dark blue) of the time series in panel (a). Panel (c): whitened log-periodogram ﹩{\rm{log}}\left[{\hat{S}}^{{\rm{LS}}}(f)\right]-{\rm{log}}\left[S(f)\right]﹩ overlaid with 1% and 5% ﹩{\chi }_{2}^{2}﹩ quantiles (orange and green solid lines, respectively) and 1% and 5% whitened Monte Carlo FALs (orange and green dotted lines).
Other Images in This Article
Show More
Copyright and Terms & Conditions
© 2026. The Author(s). Published by the American Astronomical Society.
Copyright ©
2026 Astronomy Image Explorer. All Rights Reserved.