Image Details
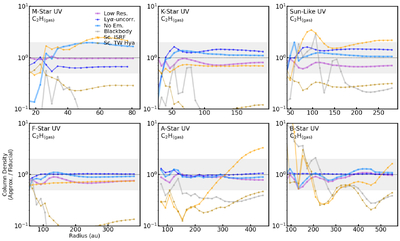
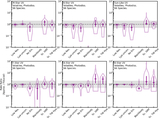
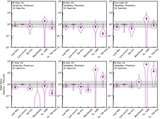
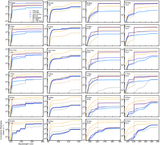
Caption: Figure 7.
Predicted gas-phase C2H column densities as a function of radius (x-axis) for each of the fiducial and spectral approximations considered (Section 2.4.7) after 5 Myr. Each line per panel is for a different type of spectrum (Section 2.3), labeled in the top left of the overall figure. All column densities are depicted relative to the fiducial column density. The horizontal dashed line marks the 1:1 correspondence line, i.e., where the approximate model exactly matches the fiducial case. The horizontal gray shaded region then marks a factor of 2 from the fiducial case. The inner 15% of each model (relative to the outermost model radius) is not shown, as these models are not built to represent the extreme environments of inner disk chemistry.
Other Images in This Article
Show More
Copyright and Terms & Conditions
© 2026. The Author(s). Published by the American Astronomical Society.