Image Details
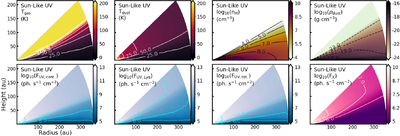
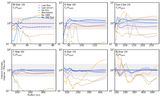
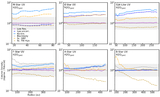
Caption: Figure 4.
Two-dimensional temperature, density, and radiation distributions (Section 2.4) used within one example astrochemical disk model (the Sun-like model; Table 1); distributions for all other disk models are in Appendix C. Top row: from left to right, the subplots display the gas temperature (Tgas), dust temperature (Tdust), number gas density of hydrogen nuclei (nH), and total mass density of dust (ρdust). The temperature and density distributions are depicted in linear and ﹩{\mathrm{log}}_{10}﹩ scales, respectively. Temperature contours are shown from 25 K to 125 K in 25 K intervals; number density contours are shown from 104 to 1010 cm−3 in order-of-magnitude intervals; and mass density contours are shown from 10−23 to 10−17 g cm−3 in two-orders-of-magnitude intervals. Bottom row: from left to right, the columns display the estimated ultraviolet radiation continuum (FUV,cont.), the subtracted Lyα radiation (FUV,Lyα), the total ultraviolet radiation (FUV,tot.), and the X-ray radiation (FX). All distributions are depicted in ﹩{\mathrm{log}}_{10}﹩ scale. Ultraviolet contours are shown at [106, 108, 1010, 1012] photons s−1 cm−2, and X-ray contours are shown at [106, 107, 108, 109] photons s−1 cm−2.
Other Images in This Article
Show More
Copyright and Terms & Conditions
© 2026. The Author(s). Published by the American Astronomical Society.