Image Details
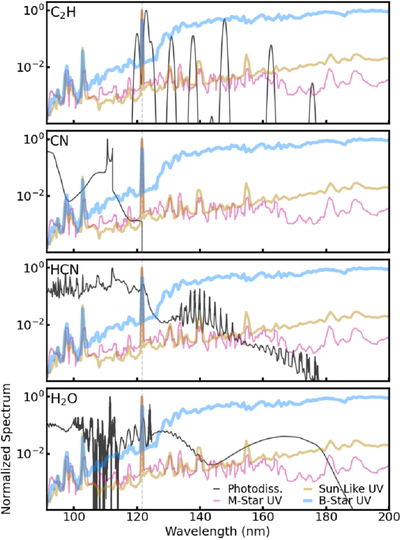
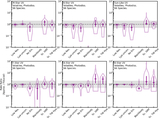
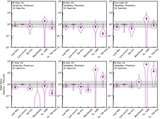
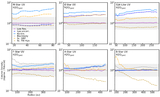
Caption: Figure 1.
Examples of the wavelength-dependent ultraviolet photodissociation cross sections (black lines) for C2H (top panel), CN (second panel), HCN (third panel), and H2O (bottom panel). Ultraviolet spectra for the M-Star (RECX 15, in thin dark pink), Sun-like (RU Lup, in gold), and B-Star (AB Aur, in thick pale blue) models are overplotted for comparison. Their Lyα emission lines are vertically marked at ∼121.6 nm in dashed gray. All spectra are plotted as a function of wavelength, and were normalized to have a maximum peak of 1 within the wavelength range of ∼91–200 nm. Cross sections and ultraviolet stellar spectra are from the public databases described in Sections 2.1.2 and 2.2, respectively.
Other Images in This Article
Show More
Copyright and Terms & Conditions
© 2026. The Author(s). Published by the American Astronomical Society.