Image Details
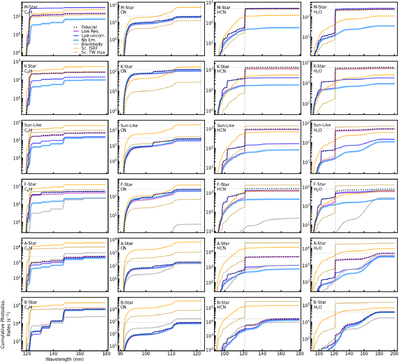
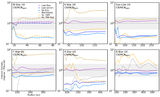
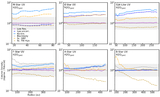
Caption: Figure 10.
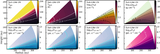
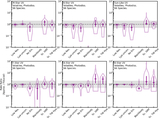
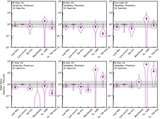
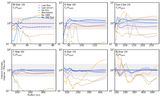
Cumulative integrals, as a function of wavelength, for computing the photodissociation reaction rates (see Section 2.1.1) for all stars (Table 1) and molecules. Each row is for a different model, with stellar mass increasing from top to bottom. Each column is for a different molecule: C2H (first column); CN (second column); HCN (third column); and H2O (fourth column). These are the same molecules that were shown in Figure 1. The cumulative integrals shown in each panel were computed using the spectra and approximations described in Sections 2.1 through 2.3: the fiducial spectrum (dotted black), described in Section 2.2; Lyα-uncorrected (thin dark blue), described in Section 2.2; low-resolution (thick purple) and no emission line (thick light blue), described in Section 2.3.1; blackbody (thick gray), described in Section 2.3.2; and the scaled TW Hya (thin dark gold) and scaled ISRF (thick pale gold) spectra, described in Section 2.3.3. The Lyα emission lines are vertically marked at ∼121.6 nm in dashed gray. The full rates computed using the fiducial spectra are horizontally marked in dotted gray.
Other Images in This Article
Show More
Copyright and Terms & Conditions
© 2026. The Author(s). Published by the American Astronomical Society.