Image Details
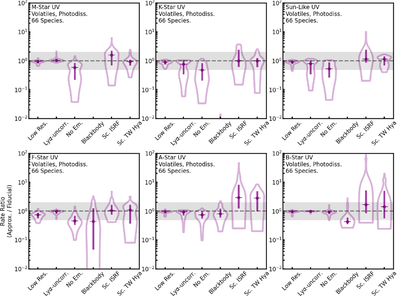
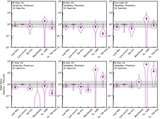
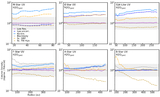
Caption: Figure 5.
Accuracy of the six different ultraviolet spectral approximations (Section 2.3) in computing the photodissociation reaction rates for volatile chemical species (where metals were excluded; 66 in all, listed in Appendix D) for the six types of models in our sample (Table 1). The x-axis labels the spectral approximations. Each violin illustrates the distribution of the relative rates (i.e., “approximate rate”/“fiducial rate”). Regions where the violins are thinner indicate lower concentrations of data points; regions where the violins are wider indicate larger concentrations. Note that all chemical species are weighted equally for each violin; i.e., prevalence and efficiency of each photodissociation reaction within the disk environment are not taken into account. Within each violin, the horizontal “-” bars mark the median (50th), and the vertical “∣” bars then span the 25th–75th percentiles. Finally, the dashed dark horizontal lines mark the 1:1 lines, i.e., the cases where the approximate rates perfectly match the fiducial rates. The horizontal pale gray regions then mark a factor of 2 relative to the fiducial rates.
Other Images in This Article
Show More
Copyright and Terms & Conditions
© 2026. The Author(s). Published by the American Astronomical Society.