Image Details
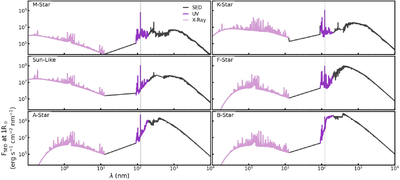
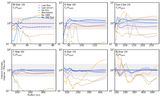
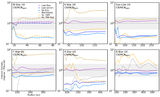
Caption: Figure 2.
Spectral energy distributions (SEDs) as a function of wavelength for the six stars in our sample (Table 1). All SEDs are from the public DIANA database described in Section 2.2. The full SEDs are drawn in black, while the ultraviolet spectra (91.2–200 nm) and X-ray spectra (20–0.1 keV) are shown in light and dark purple, respectively. All SEDs have been scaled to a distance of 1 R⊙. The Lyα emission line at ∼121.567 nm is marked vertically in dashed gray.
Other Images in This Article
Show More
Copyright and Terms & Conditions
© 2026. The Author(s). Published by the American Astronomical Society.
Copyright ©
2026 Astronomy Image Explorer. All Rights Reserved.