Image Details
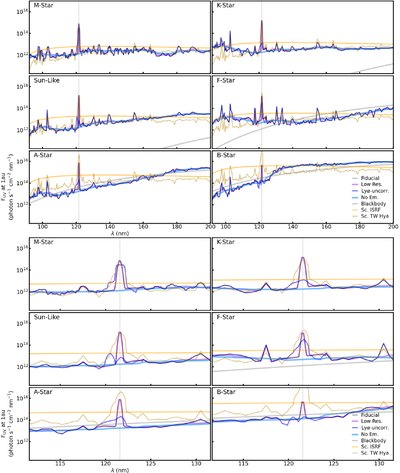
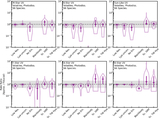
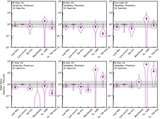
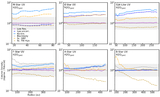
Caption: Figure 3.
Top panel: ultraviolet spectra and their spectral approximations as a function of wavelength for the six stars in our sample (Table 1). All fiducial ultraviolet spectra (thin black) are originally from the public DIANA database described in Section 2.2, and then, here, they have been updated with estimated Lyα profiles using the methodology described in Section 2.2.1. The six spectral approximations are then overplotted: low-resolution (thick purple), as described in Section 2.3.1; Lyα-uncorrected (thin dark blue), as described in Section 2.2; no emission line (thick light blue), as described in Section 2.3.1; blackbody (thick gray), as described in Section 2.3.2; and scaled TW Hya (thin dark gold) and scaled ISRF (thick pale gold), as described in Section 2.3.3. All spectra have been scaled to a distance of 1 au, consistent with the spectra used to calculate reaction rates in, e.g., A. N. Heays et al. (2017). The Lyα emission line at ∼121.6 nm is marked vertically in dashed gray. Bottom panel: same as the top figure, but zoomed in around the Lyα emission line.
Other Images in This Article
Show More
Copyright and Terms & Conditions
© 2026. The Author(s). Published by the American Astronomical Society.