Image Details
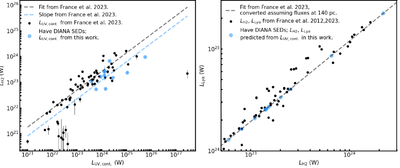
Caption: Figure 11.
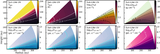
Left panel: plot of H2 luminosities (y-axis) against ultraviolet continuum luminosities (x-axis). All H2 luminosities are from K. France et al. (2012, 2023). Ultraviolet continuum luminosity estimates are either from K. France et al. (2023; small black dots) or are estimated in this work (large blue dots) by integrating the no emission-line spectra described in Section 2.3.1. All luminosities regardless of reference were computed over the wavelength range of 91.2–165.0 nm. Linear, error-weighted fits to the logarithmic data were performed to predict the literature H2 luminosities from the different sets of ultraviolet continuum luminosities; those fits are displayed separately in the figure for (1) the K. France et al. (2023) ultraviolet continuum luminosities (dashed black) and (2) the ultraviolet continuum luminosities from this work (dashed blue). Note that the latter (local) fit copies the slope from the former (literature) fit, but newly measures the y-intercept. Right panel: plot of Lyα luminosities (y-axis) against H2 luminosities (x-axis). Luminosities reported directly in K. France et al. (2012, 2023; small black dots) are compared to luminosities predicted in this work using locally estimated ultraviolet continuum luminosities (large blue dots). The empirical Lyα vs. H2 luminosity relationship presented in K. France et al. (2023) is overlain (dashed black) and was here converted from flux to luminosity assuming a standard distance of 140 pc.
Other Images in This Article
Show More
Copyright and Terms & Conditions
© 2026. The Author(s). Published by the American Astronomical Society.