Image Details
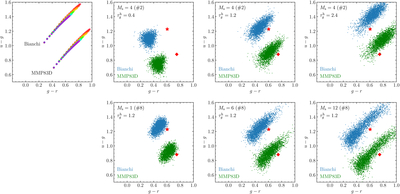
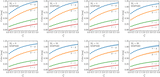
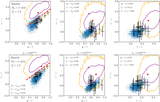
Caption: Figure 9.
Variation of the g − r versus u − g color–color diagram with changing ﹩{\tau }_{g}^{{\rm{h}}}﹩. The top left panel shows the diagram constructed from the mean colors for varying ﹩{\tau }_{g}^{{\rm{h}}}﹩ and Ms, as in Figure 5. The second, third, and fourth top panels show diagrams from a typical realization (#2) with optical depths ﹩{\tau }_{g}^{{\rm{h}}}=0.4﹩, 1.2, and 2.4, respectively, at Ms = 4. The bottom panels show the variation of diagrams as Ms changes, with ﹩{\tau }_{g}^{{\rm{h}}}﹩ fixed at 1.2. In these panels, green and blue dots represent results obtained using the ISRFs of MMP83D and S. Bianchi (2024), respectively. Diamond and star symbols indicate the initial input colors of the ISRFs of MMP83D and S. Bianchi (2024). No adjustments to the ISRFs were applied.
Other Images in This Article
Copyright and Terms & Conditions
© 2025. The Author(s). Published by the American Astronomical Society.