Image Details
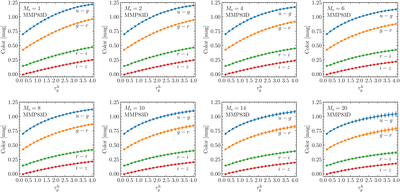
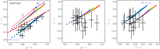
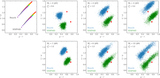
Caption: Figure 4.
Mean colors (u − g, g − r, r − i, and i − z) as functions of ﹩{\tau }_{g}^{{\rm{h}}}﹩ for various Ms. The values are averaged over 10 random realizations of the density structure in the RT simulations. Standard deviations are also shown as error bars. The ISRF SED of MMP83D was used.
Other Images in This Article
Copyright and Terms & Conditions
© 2025. The Author(s). Published by the American Astronomical Society.
Copyright ©
2025 Astronomy Image Explorer. All Rights Reserved.