Image Details
Caption: Figure 1.
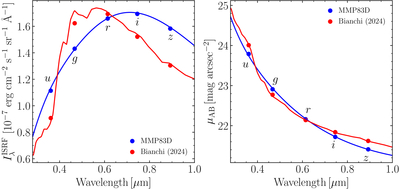
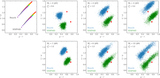
SEDs of the two ISRF models. The left and right panels show the SEDs in surface brightness units of erg cm−2 s−1 sr−1 Å−1 and mag arcsec−2, respectively. The models of J. S. Mathis et al. (1983; as updated by B. T. Draine 2011) and S. Bianchi (2024) are plotted as blue and red curves, respectively. The blue and red filled circles indicate the intensities at the central wavelengths of the SDSS bands, calculated by weighting with the SDSS filter functions.
Other Images in This Article
Copyright and Terms & Conditions
© 2025. The Author(s). Published by the American Astronomical Society.
Copyright ©
2025 Astronomy Image Explorer. All Rights Reserved.