Image Details
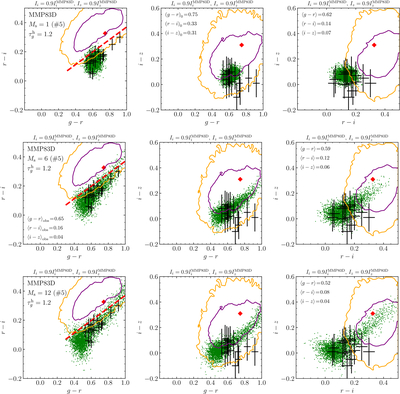
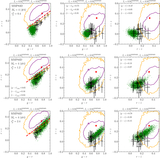
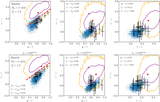
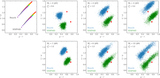
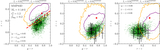
Caption: Figure 7.
Color–color diagram variations with changing Ms. The Mach numbers are set to 1, 6, and 12 in the top, middle, and bottom panels, respectively, with the cloud optical depth fixed at ﹩{\tau }_{g}^{{\rm{h}}}=1.2﹩. The modified SED of the MMP83D SED was assumed. Green dots show the simulation results of scattered light, while red diamonds indicate the colors of the incident ISRF. Observational results from the Stripe 82 region and external galaxy samples from J. Román et al. (2020) are also shown, as in Figure 6. The initial ISRF colors, the median simulated colors, and the mean observed colors are indicated.
Other Images in This Article
Copyright and Terms & Conditions
© 2025. The Author(s). Published by the American Astronomical Society.