Image Details
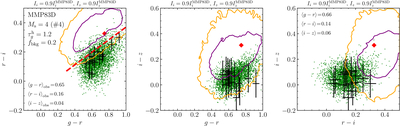
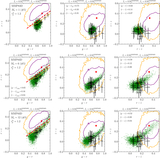
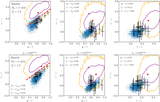
Caption: Figure 10.
Effect of differential photometry in color–color diagrams. Results are shown for a realization with Ms = 4 and ﹩{\tau }_{g}^{{\rm{h}}}=1.2﹩, assuming the ISRF of MMP83D. The panels are the same as the middle row of Figure 6, except that differential photometry is applied using Equation (7) with τ0 = 0. The background signal is set to fdiff = 0.2 of the ISRF.
Other Images in This Article
Copyright and Terms & Conditions
© 2025. The Author(s). Published by the American Astronomical Society.
Copyright ©
2025 Astronomy Image Explorer. All Rights Reserved.