Image Details
Caption: Figure 5.
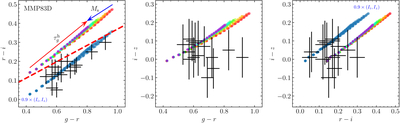
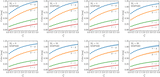
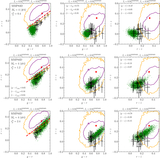
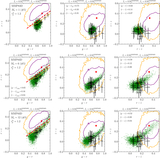
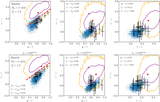
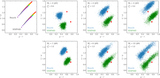
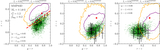
Mean color–color diagrams constructed for ﹩{\tau }_{g}^{{\rm{h}}}=0.2﹩–4.0 and Ms = 0.5–20. Rainbow-colored dots show the simulation results with the unmodified MMP83D ISRF, while light blue dots represent cases where the incident ISRF in the i and z bands is scaled down by a factor of 0.9 to reproduce the observed data. Each dot represents the average across 10 realizations for a given combination of ﹩{\tau }_{g}^{{\rm{h}}}﹩ and Ms, as in Figures 3 and 4. In the rainbow-colored series, each color corresponds to a fixed Ms as ﹩{\tau }_{g}^{{\rm{h}}}﹩ varies. The red arrow indicates the color trend with increasing ﹩{\tau }_{g}^{{\rm{h}}}﹩, while the blue arrow show the trend with increasing Ms. The black crosses mark the observational results of J. Román et al. (2020). In the left panel (r − i versus g − r), the red dashed line denotes the empirical relation used by J. Román et al. (2020) to separate cirrus clouds from extragalactic LSB features. The reddening with increasing ﹩{\tau }_{g}^{{\rm{h}}}﹩ is due to stronger extinction at shorter wavelengths, whereas the blueing with increasing Ms results from the larger volume fraction of low-density regions.
Other Images in This Article
Copyright and Terms & Conditions
© 2025. The Author(s). Published by the American Astronomical Society.