Image Details
Caption: Figure 4.
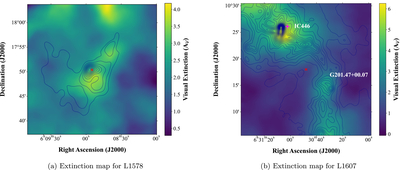
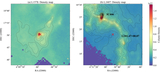
PNICER visual extinction maps having a 25 × 25 arcmin2 field of view. The visual extinction magnitude (AV) is represented by the color bar, whereas “×” indicates the center of the cloud. Superimposed on the extinction map are the contours of Herschel SPIRE 500 μm dust continuum emission. Here, the contours range from 1.4 to 68.8 MJy sr−1 with a step size of 2.9 MJy sr−1 for L1578, whereas for L1607 the range of contours is between 4.5 and 147.7 MJy sr−1 with a step size of 3.7 MJy sr−1. The contours appear to be consistent with the dust structure as unveiled by the extinction. In the extinction map of L1607, two nearby entities—the stellar cluster IC 446 (its center marked by a “+”) and the molecular cloud G201.47+00.07—are labeled for reference.
Other Images in This Article
Copyright and Terms & Conditions
© 2025. The Author(s). Published by the American Astronomical Society.