Image Details

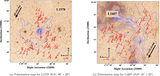
Caption: Figure 5.
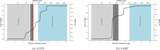
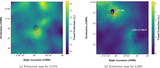
(a) Density map for L1578. (b) Density map for L1607. The column density maps with a 25 × 25 arcmin2 field of view are presented in the Herschel 500 μm resolution image in the figure. The respective contours of Herschel SPIRE 500 μm dust continuum emission for the clouds are superimposed on the column density maps as dotted lines, with their corresponding range and step size, as mentioned in the main text. The value of H2 column density N(H2) is represented by the color bar, whereas “×” indicates the center of the cloud. For reference, the nearby stellar cluster IC 446 and the molecular cloud G201.47+00.07, both adjacent to the L1607 cloud, are labeled on its density map.
Other Images in This Article
Copyright and Terms & Conditions
© 2025. The Author(s). Published by the American Astronomical Society.