Image Details
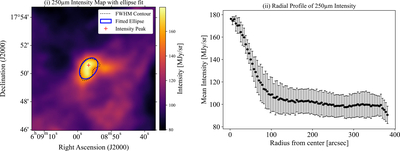
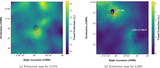
Caption: Figure 6.
Left: 250 μm intensity map of L1578 with the fitted ellipse overlaid on it. Right: mean intensity as a function of radial profile exhibiting a decreasing trend. The mean intensity is computed for each radial bin with a width of 4″. The error bars represent the corresponding error in mean intensity for each radial bin.
Other Images in This Article
Copyright and Terms & Conditions
© 2025. The Author(s). Published by the American Astronomical Society.
Copyright ©
2026 Astronomy Image Explorer. All Rights Reserved.