Image Details
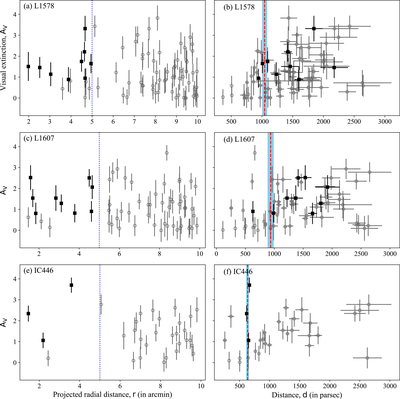
Caption: Figure 1.
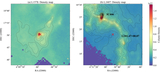
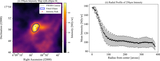
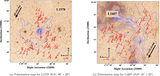
Left panels: plot of visual extinction (AV) against projected radial distance (r). The maximum radial extent (rmax) is depicted here by the vertical dotted line. Right panels: plot of visual extinction (AV) against distance to individual stars (d). In all the plots, the filled squares represent the stars selected for analysis, while the circles represent otherwise. The stars considered for the plots adhere to the conditions d/ed > 3, ﹩{A}_{V}/{e}_{{A}_{V}}\geqslant 1.2﹩, and an extinction threshold of 0.25 (L1578 and L1607) and 0.5 (IC 446). The distances to the sources are bracketed from 1007 ± 27 pc to 1080 ± 15 pc (L1578), 889 ± 14 pc to 987 ± 42 pc (L1607), and 619 ± 14 pc to 652 ± 5 pc (IC 446), respectively, which are marked by the shaded regions in the right panels. The vertical dotted line in the panel corresponds to the attributed median distances of 1043 ± 36 pc (L1578), 938 ± 49 pc (L1607), and 635 ± 16 pc (IC 446), for the target sources.
Other Images in This Article
Copyright and Terms & Conditions
© 2025. The Author(s). Published by the American Astronomical Society.