Image Details
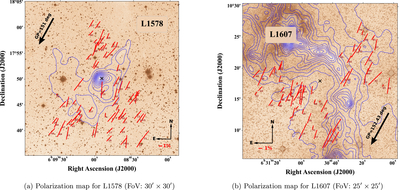
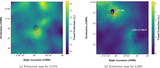
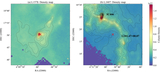
Caption: Figure 7.
Polarization maps: the polarization vectors for the field stars are shown as red line segments overlaid on the images of the respective regions, covering an area of 30 × 30 arcmin2 for L1578 and 25 × 25 arcmin2 for L1607. A reference vector equivalent to 1% polarization is displayed on each map. The center of the cloud is marked with a “×” and the orientation of the Galactic Plane is represented by a black vector on the maps. Contours of the Herschel SPIRE 500 μm dust continuum emission are also overlaid on the maps. For L1578, the contour levels range from 1.4 to 68.8 MJy sr−1, with a step size of 2.9 MJy sr−1, while for L1607, the levels range from 4.5 to 147.7 MJy sr−1 with a step size of 3.7 MJy sr−1. The numbers beside each polarization vector refer to the number of the star in Tables A2 and A3, which contains their detailed information.
Other Images in This Article
Copyright and Terms & Conditions
© 2025. The Author(s). Published by the American Astronomical Society.