Image Details
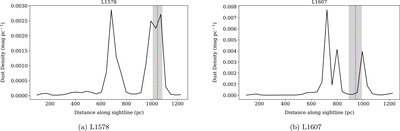
Caption: Figure 3.
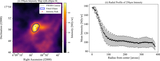
Plots of dust density (mag pc−1) as a function of distance along the sightline (pc) for the two clouds, displaying two prominent dust layers for L1578 and three dust layers for L1607, along their respective lines of sight, retrieved via the dustmaps Python package as detailed by G. Edenhofer et al. (2024). The vertical dotted line denotes the estimated median distance (1043 pc for L1578 and 938 pc for L1607) to the molecular cloud, while the shaded region represents the half-width of the bracketed range (36 pc for L1578 and 49 pc for L1607).
Other Images in This Article
Copyright and Terms & Conditions
© 2025. The Author(s). Published by the American Astronomical Society.
Copyright ©
2026 Astronomy Image Explorer. All Rights Reserved.