Image Details
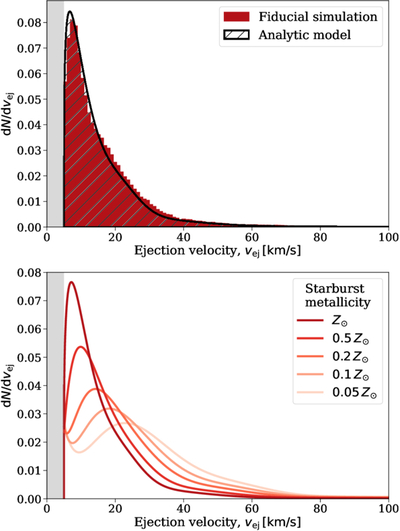
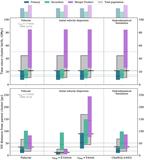
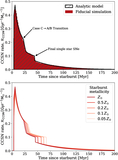
Caption: Figure 10.
Top panel: a comparison of our analytic model for the distribution of ejection velocities (Equation (7), shown in black) to our fiducial simulation for the subset of SN progenitors that are ejected with vej ≥ 5 km s−1 (shown in red, with the lower-velocity region shaded in gray). Bottom panel: the metallicity dependence of our analytic model for the ejection velocity distribution. Lower-metallicity binaries typically produce higher ejection velocities. An interactive version of this data is available in Figure 9.
Other Images in This Article
Show More
Copyright and Terms & Conditions
© 2025. The Author(s). Published by the American Astronomical Society.
Copyright ©
2025 Astronomy Image Explorer. All Rights Reserved.