Image Details
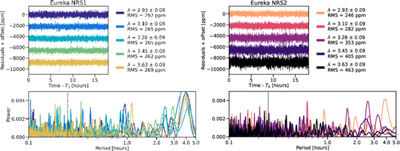
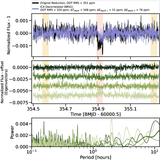
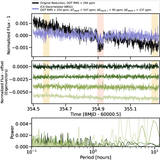
Caption: Figure 18.
Results of running the residuals of the low-resolution spectroscopic light curves through a Lomb–Scargle periodogram. (a) A gallery of the residuals from the Eureka! pipeline for each spectroscopic channel. (b) The periodogram results. The color of the lines between panels a and b is for the same white light or spectroscopic channel. The residuals show uncorrelated noise at periods of <0.5 hr. The left two panels are for NRS1; the right two panels are for NRS2.
Other Images in This Article
Show More
Copyright and Terms & Conditions
© 2025. The Author(s). Published by the American Astronomical Society.
Copyright ©
2025 Astronomy Image Explorer. All Rights Reserved.